A properly designed irrigation system will be able to supply the maximum (mid-summer) water needs of fully mature trees. But what about irrigation at times of the year when water needs are not at maximum, or for young orchards with smaller trees? A good starting point is to apply orchard evapotranspiration (ET), using one or more of the many extension or other on-line resources available (e.g., http://www.cimis.water.ca.gov/, http://www.wateright.org/). This approach requires a reference ET value, which is freely available. But also requires information about your particular orchard, including such diverse elements as irrigation system uniformity, water application rate, effective rooting depth, leaching requirement, and soil water holding capacity. For young orchards, a measure of the shade percentage on the orchard floor at midday around mid-summer is also needed. Most of these values are difficult to estimate or measure accurately, and some may vary within an orchard, so a substantial amount of ‘guess work’ is usually involved. This is particularly true for young and rapidly growing orchards, because both water demand and rooting depth increase over the season as well as year-to-year. Using the pressure chamber (also known as the ‘pressure bomb’), to periodically measure the level of water stress in the tree is a good way to check how well your guesstimate is working. Water stress is measured directly in the field using covered (non-transpiring) leaf samples, and is called midday stem water potential (SWP, http://fruitsandnuts.ucdavis.edu/pressure_chamber/). Previous research and field observations have established general guidelines for the range of SWP expected under fully irrigated conditions, known as ‘baseline SWP’ (see below), as well as symptoms in walnut that have been associated with “too little” water (Table 1).
Table 1. Table 1. SWP levels in walnuts, the corresponding water stress symptoms to expect, and a consideration of how SWP might compare to baseline values under typical weather conditions.
| SWP range (bars) | Water stress symptoms in walnut | Baseline consideration |
|---|---|---|
| -2 | (Not commonly observed) | (Likely above typical baseline) |
| -2 to -4 | Fully irrigated, low stress, commonly observed when orchards are irrigated according to estimates of real-time evapotranspiration (ETc), long term root and tree health may be a concern, especially on California Black rootstock | At or above typical baseline |
| -4 to -6 | Low to mild stress, high rate of shoot growth visible, suggested level from leaf-out until mid June when nut sizing is completed | May equal or be 2 bars below typical baseline |
| -6 to -8 | Mild to moderate stress, shoot growth in non-bearing and bearing trees has been observed to decline. These levels do not appear to affect kernel development | May equal baseline under hot/low RH conditions, but may be 2 to 4 bars below baseline under normal or cooler weather |
| -8 to -10 | Moderate to high stress, shoot growth in non-bearing trees may stop, nut sizing may be reduced in bearing trees and bud development for next season may be negatively affected. | May be 1 to 2 bars below baseline under hot/low RH conditions but 4 to 6 bars below baseline under normal or cooler weather |
| -10 to -12 | High stress, temporary wilting of leaves has been observed. New shoot growth may be sparse or absent and some defoliation may be evident. Nut size is likely reduced. | Likely 3 to 4 bars below baseline under hot/low RH conditions and 6 to 8 bars below baseline in normal or cooler weather. |
| -12 to -14 | High levels of stress, moderate to severe defoliation, should be avoided. | Likely 5 to 6 bars below baseline under hot/low RH conditions and 8 to 10 bars below baseline in normal or cooler weather. |
| -14 to -18 | Severe defoliation, trees are likely dying. | Likely 7 to 8 bars below baseline under hot/low RH conditions and 10 to 12 bars below baseline in normal or cooler weather. |
| below -18 | (Trees are probably dead or dying) | (Substantially below baseline under all conditions) |
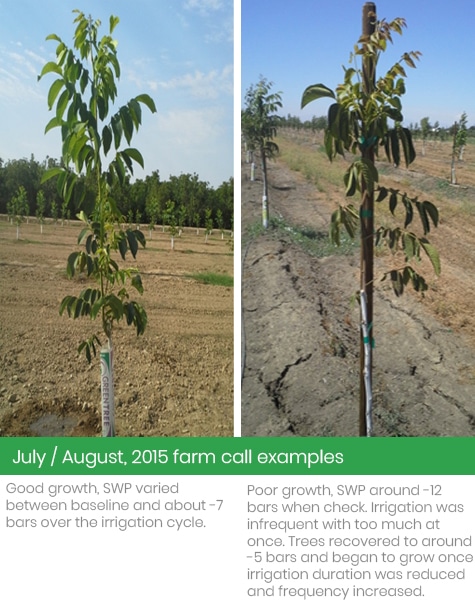
Too much followed by too little water in young orchards?
To the right is an example of how, the pressure chamber can be used as a diagnostic water management tool in young orchards. In June 2015, first leaf walnuts (spring planted on berms, bare root grafted Chandler on Paradox) in a Glenn county orchard were exhibiting generally poor but also irregular shoot growth (Figure 1, left). As part of a farm call, it was determined that the SWP of many trees in the orchard was in the high stress range of -12 to -14 bars. The trees were on a clay soil and were irrigated by capped microsprinklers (limiting the wetted area to a radius of 3-4’ around the tree) for 12h every 2 weeks, giving a total of 90 gallons of water per week per tree. Assuming that each tree had a midday shadow of about 2’ in diameter, the calculated tree water requirement would only be about 12 gallons per tree per week. But there are many assumptions in this calculation and this value has a high level of uncertainty. In any case, it is safe to say that applying 90 gallons of water per tree per week should have been more than adequate for these trees. Since the trees were exhibiting high stress, it was possible that the poor and irregular growth may have been caused by short periods of high water availability just after irrigation, giving some growth, followed by longer periods of mild stress progressing to severe stress, and no growth, over the 2 week irrigation cycle. The decision was made to irrigate for 3h every 4 days (a total of about 79 gallons of water per tree per week), and within a month, most of the trees were showing good growth (Figure 1, right), and typically exhibiting baseline SWP values just after irrigation and only mild stress (-7 bars) before the next irrigation. This example illustrates the usefulness of SWP in diagnosing and solving irrigation-related problems in young orchards. Once growth was stimulated in the trees, use of the pressure chamber was continued to further refine the irrigation frequency and duration.
Too much water in mature orchards?
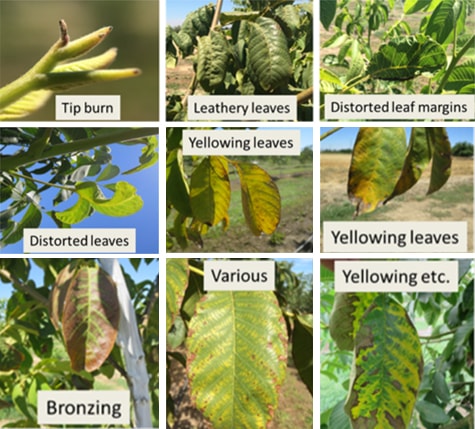
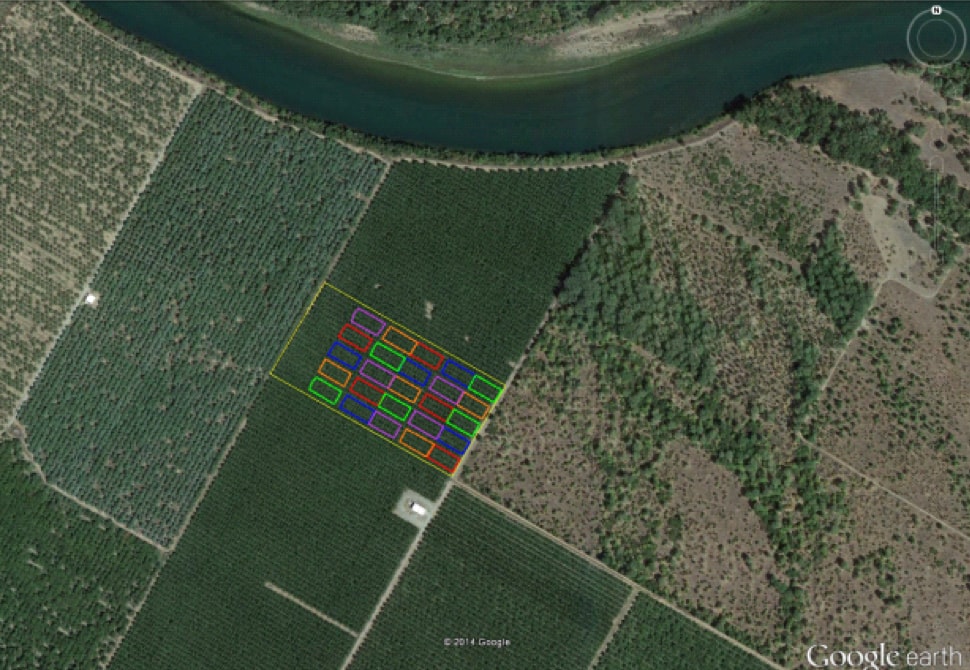
Figure 2 illustrates a number leaf symptoms which are typically associated with salt damage or mineral deficiencies/excesses. But all of these symptoms have also been associated with extended periods of wet soil conditions (too much water), particularly in the spring (April to early June). When SWP levels are consistently near or above the levels expected under fully irrigated conditions, these types of disorders are more likely to occur. Research sponsored by the California Walnut Research Board since 2014 in a commercial Chandler/Paradox walnut orchard is being conducted to determine if too much water early in the season has long-term negative effects on walnut orchard productivity. Figure 3 is a Google Earth image of the experiment to illustrate the general layout. The experiment is located in the northern Sacramento Valley near Red Bluff, California. In 2014, the orchard was 9 years old. The orchard planting configuration is 28 by 18 feet. Soils are well drained, Columbia silt loam and fine sandy loam. A solid set mini-sprinkler system is used to apply irrigation water. Mechanical hedging has been practiced since 2012 with every fourth center hedged annually. Supplemental hand pruning has been practiced primarily to control the size of every other tree in anticipation of eventual tree removal to increase tree spacing in the orchard. Tree spacing was closer to achieve earlier orchard production but wider tree spacing is of interest over the life of the orchard to optimize light and air flow in the orchard and lessen pressure from various foliar diseases that can infect buds and flowers and reduce nut set.
In this experiment, baseline SWP is being used as a reference value. Baseline SWP is the SWP expected under fully irrigated conditions, and this varies between approximately -3 and -6 bars, depending on the weather. Baseline SWP values for the most recent 6 days, from a CIMIS station near your location, can be obtained at http://informatics.plantsciences.ucdavis.edu/Brooke_Jacobs/index.php. This experiment was designed to compare the yield and nut quality effects that resulted from delaying the start of irrigation, compared to the practice of the grower, by allowing the trees to experience SWP threshold values that were 1, 2, 3, or 4 bars below the baseline value. For this orchard, the normal grower practice was to start irrigation in late April/early May. The SWP during this time was consistently at or near baseline.
Research results: Irrigation Start Date, Yield, Water Savings, and Nut Quality
From 2014-2016, irrigation start dates for the grower began 25-35 days after leafing out, and for the mildest level of stress (1 bar below baseline) the start date was delayed by an additional 20-25 days (Table 2). As expected, the more severe stress thresholds were associated with longer delays. But it was surprising that the 2 bar threshold, which would be considered a physiologically ‘mild’ level of water stress (i.e., not much effect on growth or photosynthesis), allowed delays of over 1 month compared to the grower. Yields were progressively reduced with more severe thresholds and longer delays, although the only statistically significant reduction (16%) in yield, compared to the grower treatment, occurred for the 4 bar threshold, with a delay of 60 days (Table 2). It is important to note that once irrigation started, each treatment received the same amount and frequency of irrigation as was applied to the grower treatment. There was no attempt to ‘catch up’ after the delayed start of irrigation. Consequently, all the delay treatments resulted in some savings of irrigation water (Table 2). In all cases, tree stress (SWP) recovered to normal levels once irrigation was resumed. In fact, the delayed treatments (particularly the 2 and 3 bars below baseline thresholds) tended to exhibit less water stress later in the season than the grower treatment (data not shown, but can be found in the report to the California Walnut Board, http://ucanr.edu/repositoryfiles/2015-115-160270.pdf). This result indicated that, at least under some soil conditions, concern about a loss of deep soil moisture early in the season resulting in more stress when irrigation is cutoff for harvest later in the season, may not be warranted. It may also indicate that while reducing irrigation in the spring may cause some tree stress, it also may promote a healthier, deeper, root system. Thus far, there have been no treatment effects on disease incidence or tree loss, but additional years of imposing these treatments will be required to evaluate the sustainability of this practice.
Table 1. Cumulative, three-year effects of orchard water stress levels on irrigation start date, dry in-shell yield, and relative water savings measured in 2014, 2015, and 2016.
| SWP just before the first irrigation (bars below baseline) | Approximate Irrigation Start Date | Approximate Days After Leafout | Cumulative Dry In-shell Yield (lbs/acre) | Yield Loss % of highest yield | Relative Water Savings(%) |
|---|---|---|---|---|---|
| At or near Baseline (0) | Late April to Early May | 25 to 35 | 14,051 a1 | 0 % | 0 |
| 1 | Mid to Late May | 45 to 60 | 13,780 ab | -2 % | 10 |
| 2 | Early to Mid June | 60 to 75 | 12,925 ab | -8 % | 19 |
| 3 | Mid to Late June | 75 to 85 | 12,591 ab | -10 % | 34 |
| 4 | Late June to Early July | 85 to 95 | 11,827 b | -16 % | 30 |
1 Values followed by the same letter are not statistically different.
An additional point from Table 1 is the potential to save on water and energy costs by modestly delaying the start of irrigation to one of the intermediate water stress levels. In this experiment, it was possible to reduce irrigation at least 10% and possibly more, without serious short-term impacts on yield, and with the potential benefit of deeper root development. This is worth remembering if faced with water shortages or high pumping costs in the future.
The nut quality data from all three years have consistently shown a trend toward slight reductions in nut weight for the 1 and 2 bar thresholds, and statistically significant reductions for the 3 and 4 bar thresholds (Table 2). It is interesting to note however, that while all the nut size-related measurements (weight, percent large sound, percent jumbo/large) showed the same patterns, there was no change, or even trend of a change, with irrigation threshold, in any of the other nut quality measurements such as kernel color (RLI), mold, shrivel, or percent of edible kernel (Table 2).
Table 2. Effect of early season orchard water stress on Chandler walnut quality. Values are averages over all three years.
| SWP just before the first irrigation (bars below baseline) | Approximate Irrigation Start Date | Nut Weight (grams) | Percent Large Sound | Percent Jumbo and Large | RLI | Percent Mold | Percent Shrivel | Percent Edible Kernel |
|---|---|---|---|---|---|---|---|---|
| At or near Baseline (0) | Late April to Early May | 10.4 a1 | 79.1 a | 77.4 a | 54.5 | 1.3 | 2.3 | 45.5 |
| 1 | Mid to Late May | 10.1 ab | 75.7 ab | 73.5 ab | 55.1 | 1.3 | 2.6 | 45.7 |
| 2 | Early to Mid June | 10.1 ab | 75.6 ab | 73.5 ab | 55.0 | 1.6 | 1.8 | 45.4 |
| 3 | Mid to Late June | 9.7 bc | 68.3 bc | 66.7 bc | 54.4 | 1.8 | 2.5 | 45.8 |
| 4 | Late June to Early July | 9.3 c | 57.7 c | 57.7 c | 54.7 | 1.6 | 2.7 | 46.1 |
1 Values within a column followed by the same letter are not statistically different.
Conclusions
While the evapotranspiration (ET) approach remains a good starting point for scheduling irrigation in walnuts, the availability of soil water to the tree, and the resulting level of tree water stress, depends on a number of details that are specific to each particular orchard. Many of these details are difficult to estimate or measure accurately. Midday stem water potential (SWP) is a direct measure of the level of tree water stress which has proven to be a practical and cost-effective irrigation management tool for many growers, particularly for water management in young orchards. Current research in a mature orchard is demonstrating that waiting for the occurrence of mild water stress (1-2 bars below baseline SWP) before starting irrigation in the spring, may represent an optimal balance between tree productivity on the one hand and root system health on the other. On some soils, delaying the first irrigation until 30 to 60 days after leafing out in mature orchards may be possible, but this value should be determined for each orchard using SWP or an equivalently reliable measure of water stress.